
Working Paper
The Worst Part
Why the moment your customers hate is the most valuable measurement in your business, and why nothing you own is collecting it.
WXI · Worst Experience Indicator · Working paper, revision 3 · Published by Acoustic Pte. Ltd., Singapore
Download PDF1. The most valuable sentence in your business
Somewhere in your business, right now, a customer is having the worst experience your company will produce this week.
They will not tell you. They will not call. They will not escalate. If they answer your survey at all they will give you a 7 and leave the comment box empty, because the comment box asked how their experience was, and "fine" is a complete answer to that question.
Then they will leave. And in eleven months, when someone asks why churn moved, that moment will be gone. It was never written down. The only record of it is a 7.
"Your most unhappy customers are your greatest source of learning."
Bill Gates, Business @ the Speed of Thought, 1999 ¹
That line has been on the wall of every customer experience team for twenty-five years. It gets quoted in the deck, agreed with in the room, and then the meeting moves on to the score.
Here is the uncomfortable part. Almost nobody built an instrument that collects the learning. The quote is on the wall and the data is not in the building. Every mainstream CX tool takes a single reading after the fact, on a scale, from a customer who has already averaged their entire experience down to one digit. The worst moment, which is the thing Gates was pointing at, gets averaged away in the customer's own head before your software ever sees it.
Twenty-five years of agreement, and the industry built the opposite instrument.
This paper is about correcting that. The argument runs in four steps:
- The worst moment governs what a customer remembers, tells other people, and decides about you.
- Every instrument you currently own is designed, structurally, to destroy it.
- There is a five-word question that recovers it.
- And there is a way to put a price on the answer, so that somebody actually funds the fix.
The fourth step is where most CX programmes die, and we will spend real time on it.
2. What your customers actually remember
Start with the finding that should have reorganised the industry and did not.
In the mid-1990s, two researchers recorded, minute by minute, the pain of patients undergoing colonoscopy and lithotripsy: 154 patients in one study, 133 in the other. They had the real experience on tape. Then they asked the patients afterwards how bad it had been, and compared.²
What people remembered tracked two things. The worst moment. And the last three minutes. That was it.
The total amount of pain barely registered. A procedure lasting four minutes and a procedure lasting sixty-nine minutes were remembered about the same if their peaks matched. The researchers had already named this in earlier work: duration neglect.³ The experience your customer actually had, integrated over its full length, is close to irrelevant to what they walk away with.
Then they ran the experiment that proves it.⁴
Take a colonoscopy. Add three extra minutes at the end with the scope left in place, unmoving. Uncomfortable, and noticeably milder than everything that came before it. That group endured strictly more discomfort, for strictly longer, than the control group. Every objective measure says their experience was worse.
They remembered it as less unpleasant. And they were more likely to come back.
Sit with that. You can make an experience objectively worse and have it remembered better, by changing one moment. What lives in your customer's head is a peak and an ending. Everything else is written in sand.
And the peak is asymmetric. Losses loom larger than equivalent gains,⁵ so the damage done by one bad moment is not repaid by one good one. This is why the delight programme did not work. You added peaks at the top while leaving the peak at the bottom exactly where it was, and the bottom one is the one with the weight.
Three consequences, and each one is uncomfortable.
Your average is fiction. Not a rough approximation of your customer's experience. A number that describes something no customer ever had. Nobody experiences your mean. They experience a worst moment and an ending, and then they compress it into a digit for you, badly, and you average those digits and present the result to a board.
Your worst moment is your product. Whatever else you shipped, the thing your customer will describe at dinner is the moment it went wrong. That moment is doing your marketing. It is also doing your churn.
You are almost certainly optimising the wrong thing. If your CX programme is working on the average, it is working on the part that does not survive contact with human memory.
The research has been sitting there since 1996. It is cited constantly. It is on the slide. And the instrument the industry runs on collects a summary score.
3. Why you do not have this data
You might reasonably ask why, if the worst moment is this important, nobody has it written down.
The answer is that four separate mechanisms are destroying it, and three of them are inside the tool you bought.
3.1 The customer averages it before you see it
Ask "how was your experience?" and the customer performs a computation. They take a peak, an ending, a mood, and a general sense of your brand, and they collapse all of it into one number.
By the time that digit reaches your database, the worst moment is gone. It contributed to the number. It cannot be recovered from the number. You are reading the output of a lossy compression that ran inside somebody's head, and you are treating it as data.
3.2 The instrument then averages it again
The Net Promoter Score takes that already-compressed digit and compresses it further. Scores of 9 and 10 become promoters. 7 and 8 are thrown away entirely. Everything from 0 to 6 becomes a detractor, which means a customer who gave you a 6 and a customer who actively despises you are recorded as the same event, while a 6 and a 7 are recorded as opposites.⁶
| Promoters | Passives | Detractors | NPS | |
|---|---|---|---|---|
| Firm A | 60% | 20% | 20% | +40 |
| Firm B | 40% | 60% | 0% | +40 |
Two entirely different companies. Firm A has a fifth of its customers actively hostile. Firm B has none. Their churn profiles have nothing in common, their priorities have nothing in common, and the instrument reports the same number.
Then the number arrives at a meeting with no instruction attached. You are at 32. Nothing tells you what to change. An entire consulting industry exists to sell back, at cost, the diagnosis the instrument declined to collect.
3.3 Your customers are being polite
Most people will not volunteer a criticism to a company that has given no sign of wanting one.
This is not customers being unhelpful. It is customers being normal. Complaining unprompted carries a social cost, it feels like an imposition, and the person doing it has no reason to believe anything will come of it. So they say nothing, tick 7, and leave.
The information exists. Your customer has it. Your form gave them no reason to hand it over.
3.4 And the score is being gamed at the point of collection
You already know this one. It is taught. Dealerships, hotels, support desks: explain to the customer that anything below a ten counts as a failure, ask them to raise concerns directly instead of in the survey, time the request for the moment of maximum goodwill.
Note what is being gamed. A level can be lifted by lifting the mood in the room at the moment of asking. That is what makes the whole thing so easy to corrupt, and it is a structural property rather than a moral failing of the people doing it.
Four mechanisms, all pointing the same way. Your most valuable data is destroyed by the customer, destroyed again by the scale, withheld out of politeness, and manipulated at the point of collection. Then the residue is averaged and put on a slide.
Gates said your unhappy customers are your greatest source of learning. The industry built a machine for not listening to them.
4. The question
Here is the entire recovery mechanism.
What was the worst part?
Five words. One text box. No scale.
It is the smallest component of the instrument and it does the most work, and every word in it is load-bearing.
Why people answer it
"How was it?" can be discharged in one word. It asks for a summary, and people supply "fine". The question has an exit and most customers take it, which is why your comment box is empty.
"What was the worst part?" cannot be answered with "fine". The grammar demands a thing. To answer at all, the customer has to name an incident. There is no exit.
It presupposes that a worst part exists, and that presupposition is a gift. The customer is no longer volunteering a criticism to a company that would rather not hear it. They are answering a question that has already conceded the point. The social cost that section 3.3 described just evaporated, because you paid it for them, in advance, by asking.
The superlative forces a ranking. To answer, the customer runs back through the experience and selects the worst bit. That selection is the peak. Section 2 told you the peak was the only thing that mattered and the only thing you could not get. Here it is, and the customer extracted it for you, for free, because you asked a question whose grammar required it.
Honesty is the low-effort path. Inventing a grievance takes work. Recalling the bit that annoyed you takes none.
And it is a trust act. The question concedes, out loud, that something went wrong. Compare it with an instrument that asks how likely you are to recommend the company to a friend, which is a request for a favour dressed up as research. One question serves the business. The other serves the customer and serves the business better as a consequence. People notice which one they are being asked.
What it costs you
Be clear about the trade. You will not learn what delighted anyone. The instrument is asymmetric on purpose, because the worst moment predicts churn and the best moment is pleasant to read and rarely tells you what to change. A business that wants its delights catalogued should buy a different product.
How to break it
The question is short, which makes it fragile. Five ways to ruin it:
- "Was there anything you didn't like?" Restores the exit. "No" is a valid answer and most people take it. You have rebuilt the empty comment box.
- "Why did you give that score?" Asks the customer to justify a number. You get a paraphrase of the number.
- "What was the best part, and what was the worst part?" Halves the attention, invites escape into the positive, and re-averages the exact thing you just separated.
- Multiple choice. The moment you list the options you have told the customer what counts, and you have lost the incident you did not know to list. The entire value of this question sits in the answers you did not anticipate.
- A character minimum. Punishes the customer who says the true thing in four words. The four-word answers are frequently the best ones.
Placement: immediately after the experience, one box, no page transition, no obligation. A customer who is already in the frame will answer. Send them somewhere else and you lose most of them.
5. What a sentence does that a score cannot
This is where the argument stops being about measurement and starts being about whether anything changes.
A number produces a meeting about the number.
Report that the score fell three points and watch. Someone questions the sample. Someone questions the methodology. Someone observes that last quarter was collected differently. Someone asks whether three points is even outside the margin of error, and nobody in the room can answer, because nobody in the room is a statistician.
The debate is about the instrument. It is genuinely unresolvable. It consumes the meeting, and nothing gets fixed, because nothing specific was ever put on the table.
A sentence produces a meeting about the thing.
Put this in front of the same room:
"The confirmation email arrived after the courier did."
There is no methodology to attack. There is no sample to question. There is a fact, in a customer's own words, and either it is true or somebody goes and checks. Inside ten seconds the conversation has moved from whether the measurement is sound to who owns the confirmation email.
Numbers compress as they travel upward. Sentences do not. A three-point drop becomes "slightly down" becomes "broadly flat" by the third slide. A customer's sentence arrives in the boardroom in the words the customer used. It survives the hierarchy intact, and that property is worth more than most of the analytics features you are paying for.
A verdict has no owner. A sentence has one before it finishes. A score of 32 belongs to nobody. "The confirmation email arrives after the courier" has an owner by the time you have read it aloud.
6. The problem with anecdotes
Now the objection that kills most CX programmes, and you have felt it.
You already have customer complaints. There is a folder. There is a Slack channel. There is a support queue full of people telling you exactly what is wrong, in their own words, right now, and it has been there for years.
Almost none of it gets fixed.
Not because anyone is stupid or indifferent. Because anecdotes lose arguments to budgets. Take a customer complaint to a finance director and you will be asked how many customers, how much it costs, and what happens if you do nothing. If the answer is "several people mentioned it", the fix does not get funded, and the finance director is right.
This is the graveyard. It is full of CX teams who collected excellent qualitative data, presented it with real conviction, and were asked for a number they did not have.
So the worst-part question, on its own, produces better anecdotes. Which produces a better folder. Which changes nothing.
The question is only half an instrument. It tells you what happened. It cannot tell you what it costs. And what it costs is the only sentence in the room that moves money.
Which brings us to the second half.
7. Putting a price on the worst part
To price a bad moment you need to know what the experience did to the customer. Not how they felt at the end, which includes their mood and their brand loyalty and their expectations and everything else they walked in carrying. What the experience itself did.
Two customers finish the same onboarding flow. Each rates it 8 out of 10.
The first arrived expecting very little; a colleague had warned them it was difficult. Forty minutes later they were finished and mildly delighted. They rate it 8.
The second arrived expecting excellence: the reviews, the pricing, a salesperson's promise of a fifteen-minute setup. Forty minutes later they were finished and quietly disappointed. They rate it 8.
One is a company exceeding what a sceptic expected. The other is a company falling short of what it promised. Your instrument reports the same 8, for one reason: nobody took a reading before.
The second reading
So take one.
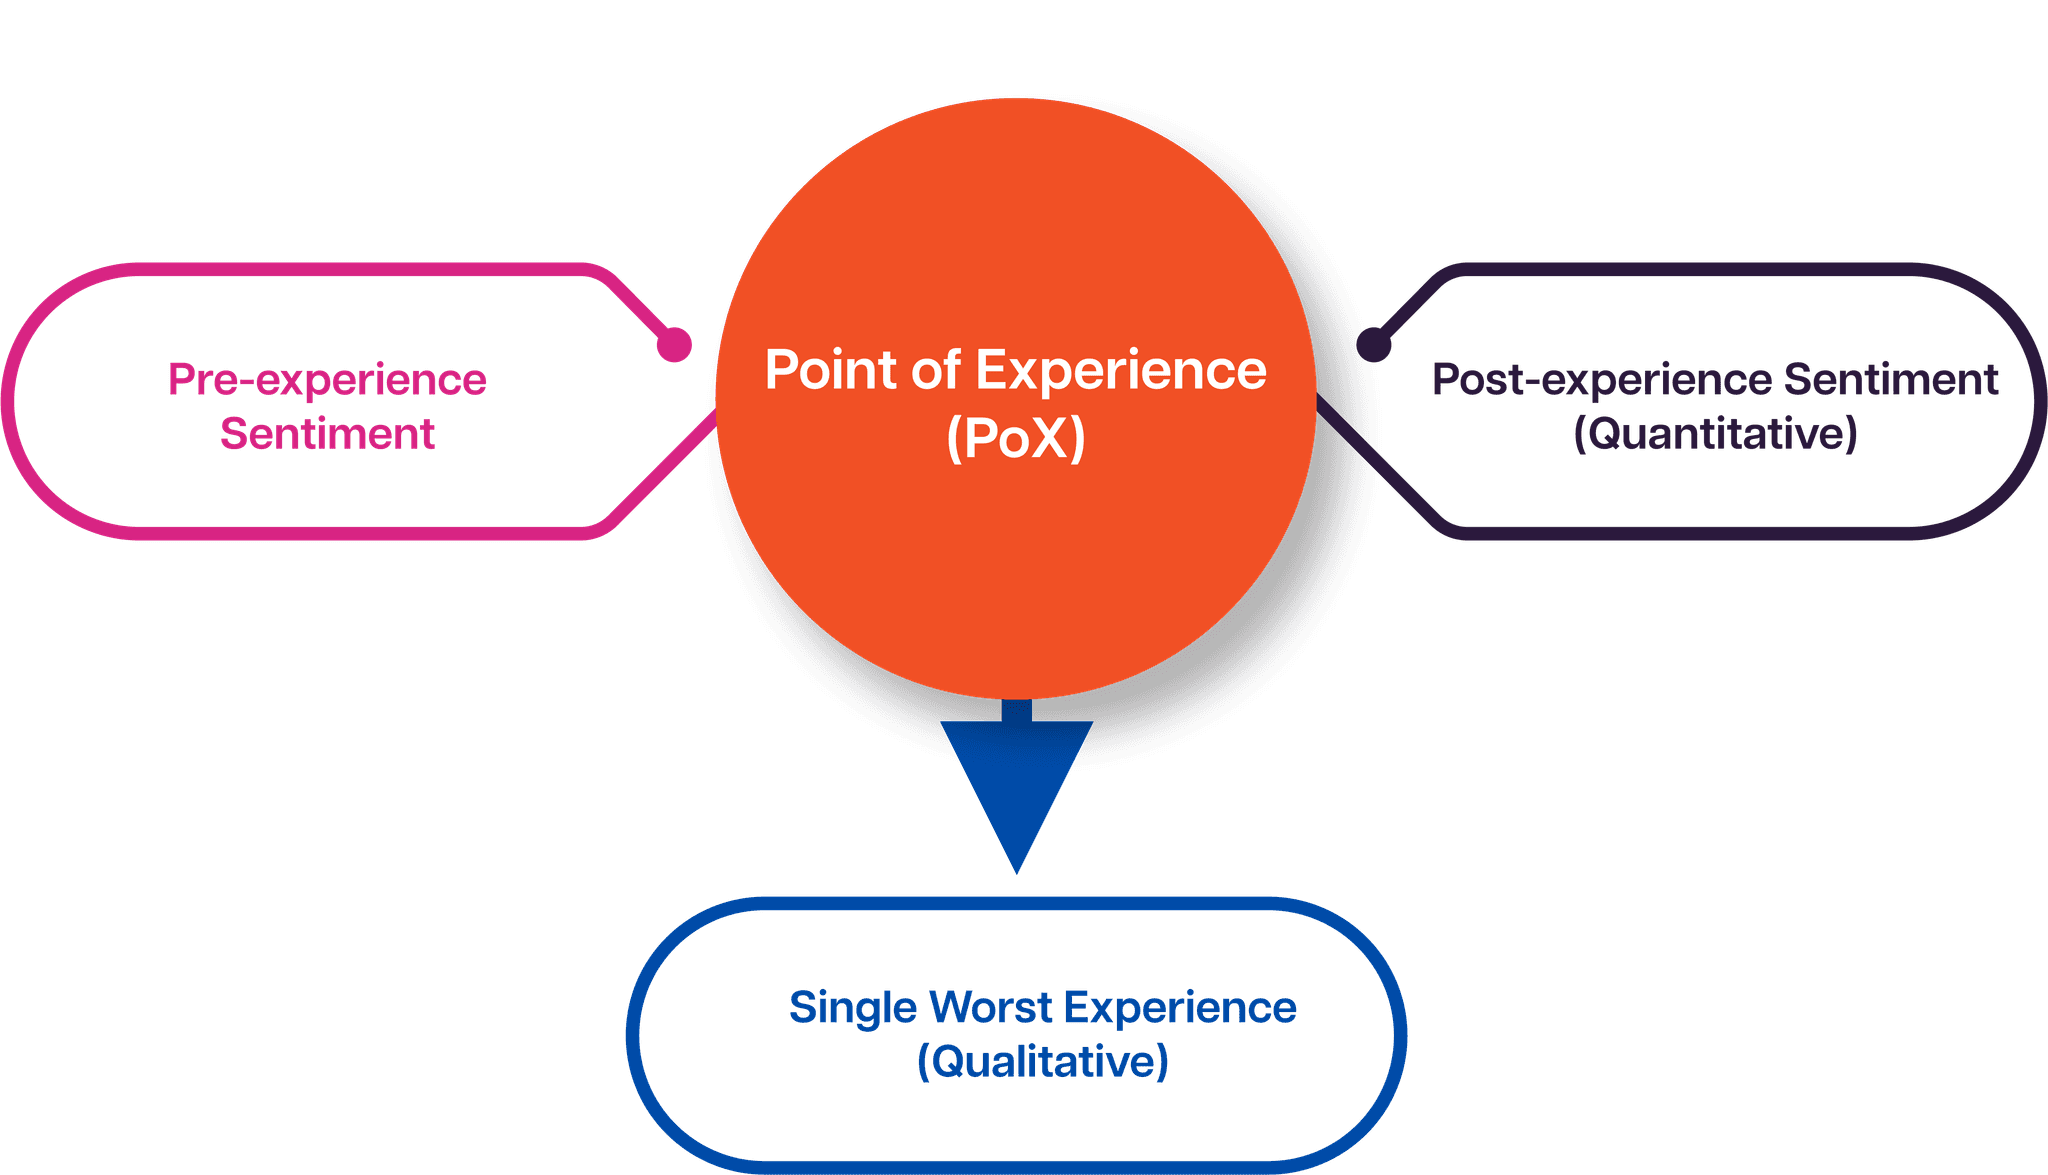
At the start of the experience, at a moment the customer has formed an expectation and has not yet had the experience, ask them one question. At the end, ask the same customer a second. Subtract.
The Formula
WXI = post − pre
Displayed to the customer as a 1 to 10 slider, stored 0 to 100, giving a range of −100 to +100.
Positive means the experience exceeded what the customer brought to it. Zero means it met expectations exactly. Negative states, in a number, by how much you fell short.
The customer's mood, loyalty, brand history and personal scoring habits are present in both readings. Subtract, and they cancel. What survives is closer to what you caused.
It is a control group of one: the same customer, ten minutes earlier.
Why this is not a new idea
It is worth saying plainly, because someone will check.
Measuring expectation against outcome is forty-six years old. Richard Oliver modelled satisfaction as a function of expectation and its disconfirmation in 1980, and his results came from a two-stage field study: he measured people before, and he measured them again after.⁷ The paradigm has been the dominant account of customer satisfaction ever since, with well over ten thousand citations.
The theory has always required two readings. The industry approximated with one, because in 1980 two readings meant fieldwork, and through the 2000s it meant two mailings and a matching problem. Every approximation abandoned the temporal separation the theory required, and the most popular one abandoned expectation altogether.⁸
A script tag on a confirmation page now collects a pre-reading in one tap, with a session identifier that solves matching for free. The constraint was technological and it has lifted. That is the whole claim: this is the old theory, measured the way it always said it should be measured, at a cost that only recently became negligible.
One more thing the subtraction buys
A level can be gamed. A difference is much harder to game, because you would have to manipulate two moments in opposite directions, and the first one happens before your staff member knows how the interaction is going to go.
You can beg a customer for a ten. It is considerably harder to beg a customer for a delta.
The same logic handles the cross-border problem. Response styles differ systematically by country: a 26-country study found power distance, collectivism, uncertainty avoidance and extraversion all predicted how people use scales, with Japan showing the lowest acquiescence and the highest midpoint responding of all 26. Run the survey in English to non-native speakers and you add a further artefact that varies with their English.⁹ Your regional comparison is partly a comparison of national scoring conventions.
A difference between two readings from the same person cancels a stable response style. Someone who avoids the extremes avoids them twice.
And now the two halves work
Put the question and the delta together and you get a thing neither produces alone.
| Theme | Delivery window given as a day, not a time |
| Share of worst-part responses at this Point of Experience | 34% |
| WXI at this Point of Experience | −11 |
| Monthly volume | 12,000 deliveries |
That is not an anecdote. It is a named problem, holding a measured share of a measured loss, across a known volume. It is a business case, and it was assembled out of a slider and a text box.
A finance director will act on that. A finance director will not act on a folder of complaints, and is right not to.
This is the whole thing.
- The delta says where, and how much.
- The sentence says what.
- Neither one moves a budget. Together they produce a ranked work order with a price on it.
That is what a CX programme was always supposed to produce, and it is what none of them produce, because they were built on an instrument that collected half of the input and destroyed the other half on the way in.
8. The instrument, briefly
The Point of Experience is the unit: a bounded interaction with an identifiable beginning and end. A support ticket. An onboarding flow. A delivery. A booking. A trial. An appointment.
Boundedness matters, and it disqualifies things. The qualifying test is concrete: does a page or message already exist that the customer sees immediately before the experience begins? Confirmation screens, booking acknowledgements, ticket receipts, dispatch notifications, appointment reminders, trial welcome pages. Where one exists, the pre-reading costs nothing to place. Ambient, unbounded relationships with a brand are out of scope, and we would rather say so than sell you something that will not work.
The join is the critical path. The two readings must be joined to the same person, differenced per person, and aggregated only afterwards. Compare the mean pre-reading against the mean post-reading across a population and you have a between-groups difference that quietly reintroduces every confound the method exists to remove, because the people who answered at the end are not the people who answered at the start. This is the single point at which a careless implementation silently turns the instrument back into the thing it replaced.
Themes have to hold their names. Free text at volume needs structuring, and a classification pipeline that regenerates its categories nightly will turn "Delivery window confusion" into "Unclear delivery timing" into "Scheduling communication", at which point the trend line means nothing and the pricing table in section 7 cannot be built at all. Themes are persistent named entities with identity across runs. New responses join existing themes where they fit. New themes appear only where they genuinely must.
That last one looks like an engineering detail. It is the mechanism. Theme stability is what converts a pile of sentences into a priced work order, and it is the reason section 7 works.
9. Where this could be wrong
Any paper that omits this section is marketing. Four objections are serious, and if we are asking your customers what the worst part was, we can manage the same about our own instrument.
9.1 Difference scores have a bad reputation, and it is earned
This is the strongest attack that exists on this method and it comes from the literature.
A well-known 1993 review concluded that difference scores suffer from problems of reliability, discriminant validity, spurious correlation and variance restriction, and should generally not be used in consumer research.¹⁰ It landed hardest on SERVQUAL, the service-quality instrument built on an expectation-minus-perception gap. A performance-only alternative was found superior, and replicated.¹¹ The gap model lost that argument.
The mechanism. Difference the two measures and the errors add while the true-score variance partially cancels, and the cancellation is worst when the two components correlate highly. In SERVQUAL, expectation and perception were captured on one instrument, in one sitting, from a respondent who already knew the outcome. Of course they correlated. The reliability collapsed.
Why this instrument is different. The pre-reading here is taken before the outcome exists. It cannot be contaminated by an event that has not happened. That lowers the correlation between the two components, which means less cancellation and a more reliable difference. The critique's own central mechanism is weakened by the one property that separates this from SERVQUAL.
And the claim is different. That literature attacks difference scores used as measures of a construct, where a direct measure exists and works better. This instrument offers the difference as a measure of change, where subtraction is the definition of the quantity rather than a proxy for it.
The concession, which is real. The reliability penalty does not vanish. Two consequences, both binding:
- Individual deltas are noise. One customer's WXI of −22 says very little about that customer. Delta is an aggregate statistic at a Point of Experience, and any interface that presents per-customer deltas as diagnostics is inviting people to over-read noise.
- You need more data than a single-reading tool needs, to say the same thing with the same confidence. That is the price of the design. It is worth paying, and you should hear it from us before you buy rather than discover it in month three.
9.2 Asking for an expectation might change the experience
Stating a number may anchor the judgement that follows,¹² or it may sensitise the customer to disconfirmation, or it may simply focus attention on evaluation and change what they notice.
The direction is not obvious and we do not know the answer.
It is also cheaply testable: randomise the pre-reading across arriving customers, then compare the post-reading distribution of those who gave one against those who did not. Matching distributions mean the effect is immaterial. Diverging ones are a finding worth publishing.
Running that test and publishing the result, whatever it shows, is an obligation of anyone advancing this method, and it is on our roadmap rather than in our marketing.
9.3 A strong brand is mechanically penalised
A customer arriving at 95 out of 100 has a maximum possible delta of +5. One arriving at 30 has 70 points of headroom.
Effective marketing raises expectations, which consumes headroom, which suppresses delta. A luxury hotel and a budget airline cannot be compared on raw delta, and the comparison would flatter the airline. Raw delta is comparable within a firm over time, and across Points of Experience in a similar baseline band. Across firms with different brand positions it is an error.
So always report the baseline distribution alongside the delta. A +2 against a mean baseline of 88 and a +2 against a mean baseline of 41 are different results. Reporting the delta alone would reproduce exactly the information-destroying move we spent section 3.2 criticising, and we would deserve everything we got.
9.4 The orphaned baseline
The most dangerous one, and the one the method turns into an asset.
Only customers who complete both readings produce a score. Customers who abandon midway never produce a post-reading and vanish from the aggregate. Abandonment correlates with things going badly. An instrument built to find the worst experiences is exposed to losing exactly those experiences to attrition. That has to be said out loud.
The recovery is that leaving leaves a trace. A pre-reading with no matching post-reading is an orphaned baseline, and it is data:
- Its existence is a signal. Somebody came in and did not leave through the door you were watching.
- Its rate is a metric. Orphaned baselines per Point of Experience is an abandonment measure that costs no additional instrumentation.
- Its value carries information. A cohort of orphans clustered at high pre-readings describes customers who arrived hopeful and left before the end. That population is worth more than most of the reports a CX platform will sell you.
A single-reading instrument is blind to this by construction. It has nothing to be orphaned from. A customer who abandons simply fails to respond, and a non-response is indistinguishable from indifference.
9.5 A limitation with no fix
There is no benchmark corpus. Everyone in the room knows what an NPS of 30 means, and that familiarity is the incumbent's real and underrated moat. A director presenting a WXI of +4 has to teach the room a new scale first, and executives have limited patience for that.
There is no clever answer. It resolves with accumulated data and time.
10. Monday
If you take one thing from this paper, take the question. It costs nothing and you do not need us to run it.
Add "What was the worst part?" to something. One touchpoint. One text box. No scale, no multiple choice, no character minimum, no "was there anything you didn't like". Ask the actual question.
Read the answers yourself. Not a summary. Not a sentiment score. The sentences, in the customer's words, for a fortnight.
Notice what happens in the first meeting where you read one aloud. Notice that nobody argues with it. That is the whole mechanism, and you can feel it working before you have bought anything.
Then you will hit the wall in section 6. You will have a folder of true, specific, unarguable statements about what is wrong with your business, and you will not be able to get any of it funded, because you cannot say what it costs.
That is the point at which you need the second reading. And that is what we build.
11. What it takes to run
The method is straightforward. Running it is an engineering problem, and the engineering is where it either works or quietly reverts to the thing it replaced.
The join has to hold across two moments and two systems. The pre-reading has to cost exactly one tap on a page somebody else built. Themes have to keep their names across runs, for years. Orphaned baselines have to be preserved rather than swept up as errors. Capture has to survive traffic without dropping a row, on a public endpoint, under tenancy isolation strict enough that one company's candour never reaches another company's screen.
Every one of those has a silent failure mode. Each is a place where a well-intentioned implementation produces numbers that look plausible and mean nothing, and tells nobody.
That is the part we build. A companion technical paper sets out the reference implementation: the capture snippet, the join, the classification pipeline, theme persistence and the reporting model.
12. The argument in one page
Your customers remember a peak and an ending. Everything else washes out, including the duration, including the average.
The peak is usually the worst moment, and losses weigh more than gains, so that moment is doing your churn and your word of mouth regardless of what else you shipped.
You do not have it written down. The customer averaged it away before your form loaded. Your scale averaged it away again. Politeness kept it out of the comment box. Your staff were coached to keep it out of the survey.
There is a question that recovers it, and it is five words long, and it works because its grammar refuses "fine" and its premise removes the social cost of saying the true thing.
The answers are worthless until priced. A folder of complaints has never been funded by anyone. Take a reading before the experience and one after, subtract, and the customer's mood and loyalty and expectations cancel out, leaving what you caused. Now the theme has a number attached, and the number is what moves money.
The delta says where and how much. The sentence says what. Together they are a work order.
Bill Gates was right in 1999, and the instrument the industry built does the opposite of what he said. That is a twenty-five-year-old error, and it is fixable this quarter.
An instrument that asks customers what the worst part was should be able to say what the worst part of the instrument is. Section 9 is our attempt. If we have missed one, we would like to hear it, and we will publish it.
Notes
- Gates, B. (1999). Business @ the Speed of Thought: Succeeding in the Digital Economy. Warner Books.
- Redelmeier, D. A., & Kahneman, D. (1996). Patients' memories of painful medical treatments: real-time and retrospective evaluations of two minimally invasive procedures. Pain, 66(1), 3–8. DOI: 10.1016/0304-3959(96)02994-6.
- Fredrickson, B. L., & Kahneman, D. (1993). Duration neglect in retrospective evaluations of affective episodes. Journal of Personality and Social Psychology, 65(1), 45–55.
- Redelmeier, D. A., Katz, J., & Kahneman, D. (2003). Memories of colonoscopy: a randomized trial. Pain, 104(1–2), 187–194. DOI: 10.1016/S0304-3959(03)00003-4.
- Kahneman, D., & Tversky, A. (1979). Prospect theory: an analysis of decision under risk. Econometrica, 47(2), 263–291.
- Reichheld, F. F. (2003). The one number you need to grow. Harvard Business Review, 81(12), 46–54. On replication: Keiningham, T. L., et al. (2007). A longitudinal examination of Net Promoter and firm revenue growth. Journal of Marketing, 71(3), 39–51. DOI: 10.1509/jmkg.71.3.039. And Morgan, N. A., & Rego, L. L. (2006). The value of different customer satisfaction and loyalty metrics in predicting business performance. Marketing Science, 25(5), 426–439. DOI: 10.1287/mksc.1050.0180.
- Oliver, R. L. (1980). A cognitive model of the antecedents and consequences of satisfaction decisions. Journal of Marketing Research, 17(4), 460–469. DOI: 10.2307/3150499.
- Parasuraman, A., Zeithaml, V. A., & Berry, L. L. (1988). SERVQUAL: a multiple-item scale for measuring consumer perceptions of service quality. Journal of Retailing, 64(1), 12–40.
- Harzing, A.-W. (2006). Response styles in cross-national survey research: a 26-country study. International Journal of Cross Cultural Management, 6(2), 243–266. DOI: 10.1177/1470595806066332.
- Peter, J. P., Churchill, G. A., & Brown, T. J. (1993). Caution in the use of difference scores in consumer research. Journal of Consumer Research, 19(4), 655–662. DOI: 10.1086/209329.
- Cronin, J. J., & Taylor, S. A. (1992). Measuring service quality: a reexamination and extension. Journal of Marketing, 56(3), 55–68. DOI: 10.1177/002224299205600304.
- Tversky, A., & Kahneman, D. (1974). Judgment under uncertainty: heuristics and biases. Science, 185(4157), 1124–1131.